We Won

[via Compete]![]()

This graph shows the number of users logged in through Thursday evening on February 22. 150,000 Facebook users care more about [Grey's Anatomy] than their friends.
One of beauties (as well as detriments) of the innernet is that it provides marketers and product hawkers detailed information about their target demographics; and it does this better than any other medium (Nielsen ratings, my ass.) What's really interesting, however, is when you see (as in the graph above) how an internet audience is affected by television. Every Thursday the Facebook team watches the activity on their site take a dramatic dive at the start of Grey's Anatomy, and then return to normal levels thereafter (it even rises a bit during the commercial breaks.)
Services like Facebook and Myspace are in a unique position here. Besides monitoring their members actions, locations, colleges, and interests -- they're able to monitor activity because so many members keep the window open all the time. Case in point, this guy:
A Goldman Sachs trader in the UK named “Charlie” was warned by his employer that his visits to Facebook on company time were to stop. He spent, apparently, over 500 hours on Facebook in a six month period. That works out to about 4 hours per day.500 hours on Facebook. That's a five with two zero's after it. As a trader for Goldman Sachs, he probably made 500 dollars for each of the hours he spent trolling Facebook looking at his friend's younger sister's pictures.
murder takes his pseudonym seriously. and details!
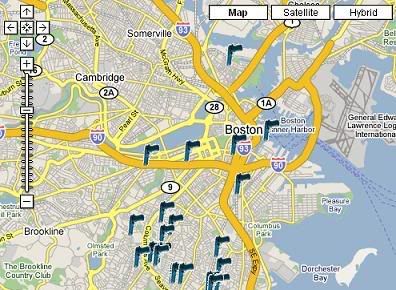
Boston-Online.com has taken people's morbid fascination with daily police blotters to a whole new level. By taking an interactive Google map and putting a graphic of a .45 everywhere someone gets killed in the city, they've turned violent crime into a totally awesome online scavenger hunt. There are details of each murder too, and even a place for comments. It's awesome to read the comments and totally be able to tell which are written by white kids.
"YO DAMN HERMAN MAN I WAS MAD AS HELL WHEN I GOT THA NEWS THAT YOU PASSED MY NIG. I SORRY TO SEE THAT YOU HAD TO GO OUT LIKE THAT. YOU WAS NEVER THE TYPE TO POST UP ON THE CORNER AND DO THE SHIT THAT OTHER NIGGAS WERE DOIN YOU WAS A LEADER AND ONE OF THE BEST DAYCARE FOOTBALL PLAYERS I KNOW AND YOU WILL BE MISSED NEVER FORGOTTEN. ARMANI AKA SKILLZ SAVE A SPOT FOR THE NEXT FALLEN SOLIDER DUE TO STREET WAR"Also, here is the weirdest crime rate comparison graph I've ever seen. It looks like New York has really gotten tame compared with cities like Baltimore. What a bunch of pussies.
"Whoah, right near Wheelock College!"
Pretty cool depictions of international strife and suffering. From the site:
We started to research relevant, global, and current facts and, thus, came up with the idea to put new meanings to the colours of the flags. We used real data taken from the websites of Amnesty International and the UNO.


I hate my family spikes again over Christmas -- though not as high as Thanksgiving. Viewing the 90 day graph you can see the difference.
Posts that contain "i Hate My Family" per day for the last 30 days.
[previously I Hate My Family]![]()
Technorati and Google's BlogSearch allow an interesting sampling of trends of those represented on the internet. While it may not be the best metric for measuring these things, it provides a starting place (or evidence, at the least) of exploring these ideas. I've been trying to find a way to place a widget here on the sidebar exploring some of these ideas, but I think the Technorati graph here will suffice. More after the jump.
Posts that contain "i Hate My Family" per day for the last 30 days.
Its no secret that when people get together with their families, their loathing of familial bonds increases. Look at how that graph spikes right around Thanksgiving. People are blogging about it on turkey-day and right afterwards... when they get back to their offices and homes -- when they've left their blood ties behind and can be free like the rabid wild beasts of exciting interoffice mail that they are.
Expect an increase during December 25th as well.
I've got a running blogsearch going on in the sidebar so you can see how much people hate their families as we approach Christmas.
[idea via ViralVideoChart]![]()
